Causal Loop Diagrams (CLDs) can be used for highlighting structure that is important for causing behavior. Often, these are created by hand based on a developed understanding of a model. Using the technology discussed in the Loops That MatterTM Overview it is now possible to automatically generate insightful CLDs. The process by which these loops are created, laid out, and displayed is discussed in Schoenberg.
CLDs can also be generated based on the tags of model variables (whether or not Loops that Matter is enabled). CLDs generated in this manner can't be simplified (the Loops Panel is not visible when generating CLDs this way).
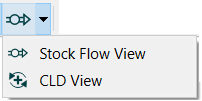
After a model is run, as long as Loops that Matter is enabled, you will see the Loops Panel. When it first opens, this panel will list the loops that have been detected and their relative importance. In addition, in the top toolbar you will see a button to select the CLD view:
Note If you are in Edit mode, or have not run Loops that Matter, then selecting CLD View will open the CLD Tag Selection dialog box and create a CLD based on tags.
There is also a button on the Loops Panel to generate a CLD for a selected loop or loops:

These buttons will open the CLD view, a read only representation of the model as a Causal Loop Diagram.
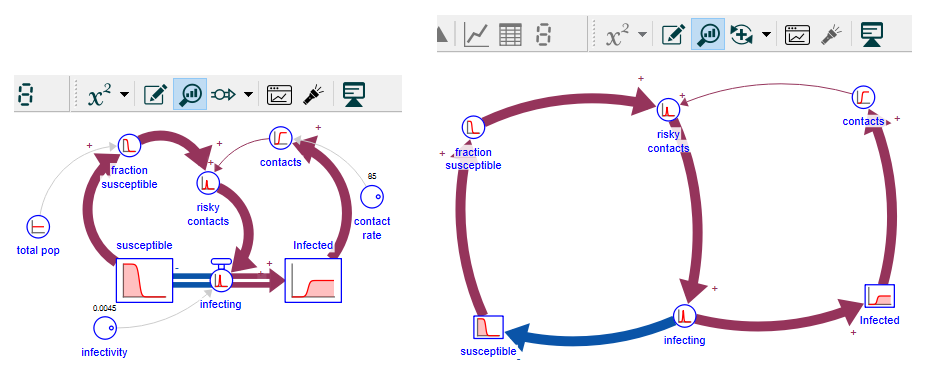
In the above example the two representations have exactly the same content, except that the two constants and total pop (which are not part of any feedback loops) are left off. This is a model with two feedback loops, and both of them are shown.
You can create CLDs based on the full set of loops in the model, or based on only selected loops. The first starts from the full model structure and can the be used to highlight important structure based on the contribution of different feedback loops to model behavior. The second focuses in only on loops that you select, ignoring the rest of the model structure. The results are often quite similar, but selecting loops as a basis for creating the CLD can make it easier to explain the resulting diagram.
To create a CLD based only on specific loops click on the button
either with the original model stock and flow diagram showing, or while looking at a model based CLD.
When viewing loop based CLDs you can return to the model based CLDs by clicking on

and you can also change which loops you want the diagram to be based on by highlighting the loops (just clicking on them to toggle their selection status) and then clicking on the button

If you have selected the Simplified Loops tab as described in the Loops Panel the button will be labeled

To reflect the fact that a simplified loop may be composed of more than one loop from the model. In this case building the loop based CLD will be done as if all the different loops composing the simplified loop were selected. If the simplified loop is only composed of 1 loop as shown in the Loops Agg. column there will only be 1 model loop included.
For larger models, it is often helpful to simplify the diagram. This is done from the Loops Panel using the Loop Simplification parameters:
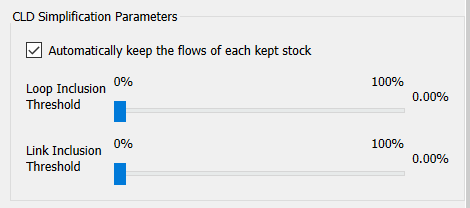
Note Loop based CLDs can be simplified by changing the Link Inclusion threshold, but will always include the selected loops. Therefor the Loop Inclusion Threshold is not shown.
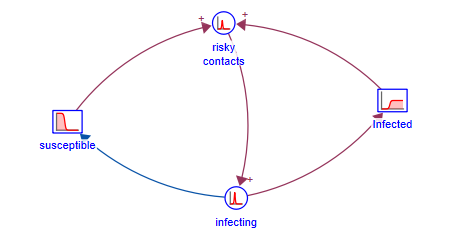
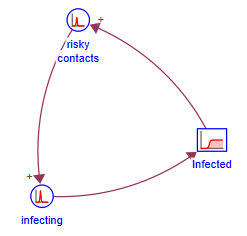
In the example shown at the beginning for example, setting the Link Inclusion Threshold to 100% would give the simplified diagram:
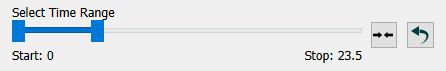
It is also possible to focus in on the loops active over a period of time. To do this use the time range selector:
For this model only the positive loop will be shown with a loop inclusion index of 37%.
Note When looking at specific loop based CLDs the time range control is not visible as this does not impact the loops selected.
Experiment with the link and loop inclusion thresholds to include more or less structure in the . What diagrams will be most useful for both understanding and explanation depend on the model. More general comments on this are contained in in Schoenberg.
Click on the simplified loops tab of the loops panel:
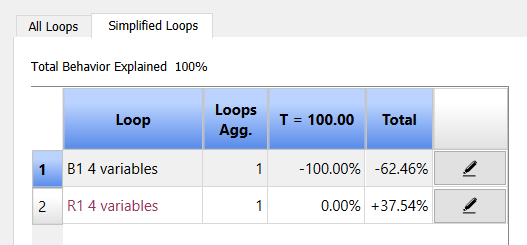
This will list the loops displayed in the simplified diagram. It will also show the percent of behavior in the model over the selected time range that is explained by the diagrams show (100 in this case).
The Loops Agg. column shows how many of the original loops in the model are embodied in a simplified loop (see Composite Links and Loops below).
You can highlight loops on the simplified CLD the same way you do on the model using the ![]() button to the right of the loop description..
button to the right of the loop description..
Because the CLD created does not contain all variables, some connections between the variables that do remain can represent multiple paths. For example if there were connections from A to B to C, and also from A to C, then if only A and C are in the simplified CLD the connection from A to C actually represents both of the original connections. If A to B was a reinforcing (R) connection, and A to B to C a balancing (B) connection, then the composite A to C connection will be marked unknown (U). As a rule of thumb, the appearance of unknown loops is likely to be an indication that the CLD is over simplified. Consider decreasing the loop or link inclusion thresholds if you see these.